 Manual
Manual
Manual
This dialog provides the means to perform a scan of possible regularization parameter (alpha) values. The final selected Alpha value - a number between 0.0 and 1.0 - is passed back to the Analysis Control dialog of PCSA. A full Parametrically Constrained pass can then be performed for the constant Alpha value.
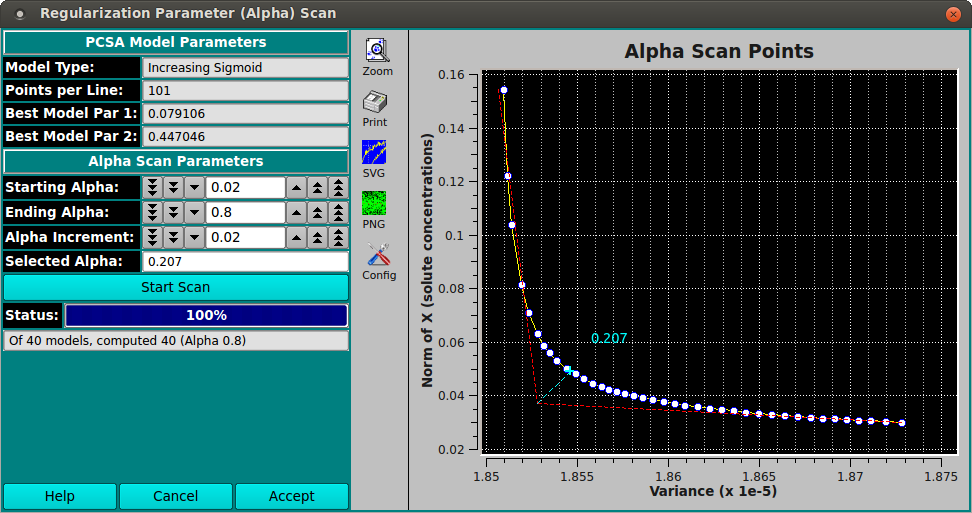
The dialog begins with the final best model from an initial PCSA scan. The user chooses a range and increment of Alpha values and initiates a scan that computes models, each of which will have an associated variance and x-norm-squared value. The plot produced tracks a line through each of those points. The "elbow" of the curve is analytically determined and graphically represented. The Alpha of the elbow point may be accepted as is. Alternatively, the user may select a different point by holding down the Ctrl key and the left mouse button while positioning the resulting vertical line at the desired curve point. At mouse button release, the Alpha is displayed beneath the vertical line and in the Selected Alpha text box. Clicking the Accept button will close the dialog and communicate the Alpha in the text box to the calling PCSA Analysis Control dialog. Note that the text box Alpha may be manually changed to refine the accepted value.
The dialog images below show the plot results after a scan of Alpha values has completed. The yellow line connecting white dots tracks the variance, x-norm points associated with each Alpha. The red dashed lines are straight lines fitted to the first and last 5 points of the curve. The cyan line extends from the intersection of the two red lines to the point on the curve nearest to it. That nearest point is taken as the "elbow" of the curve; and its associated Alpha is the automatically determined best value. In the second image below, the user uses the Ctrl key and left mouse button to select an overriding elbow point and its associated Alpha value.

Note that Model line point and variation values may be selected for speed in preparation for the Alpha scan. Once the Accept button is clicked here and focus is returned to the Analysis Control dialog, larger point and variation values may be used, along with the selected Alpha, in order to compute a more accurate final model.
[% INCLUDE footer.us3 %]