[% INCLUDE header.us3/
title = 'UltraScan III PCSA Model Lines Plot'
%]
UltraScan Model Lines Plot for PCSA:
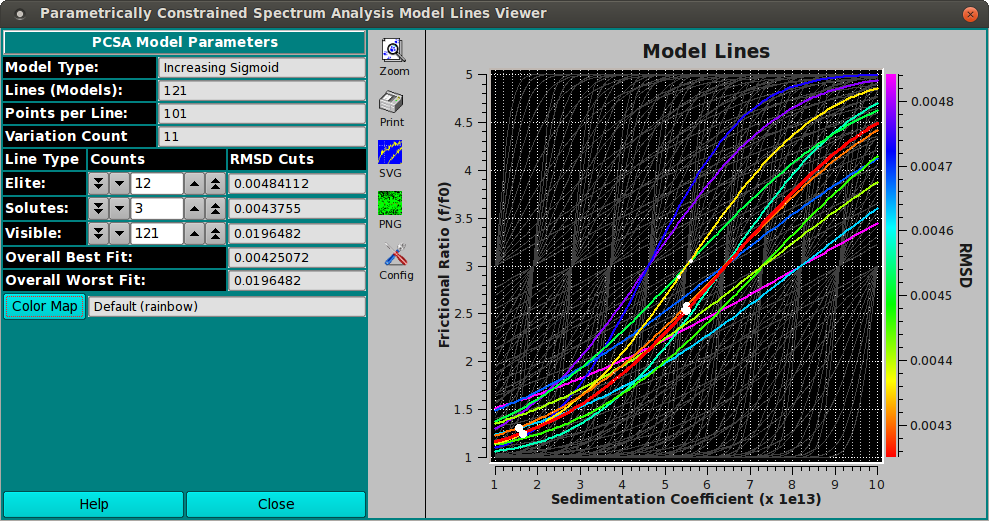
This dialog displays the lines in s x f/f0 space that define models
evaluated by Parametrically Constrained Spectrum Analysis. The lines
from the best models are illustrated with color coding. Worst-model
lines are shown with dark gray lines or may be removed from the plot.
A selected set of the best model lines contain white dots showing
computed solute points, with size proportional to relative concentration.
The appearance of the plot may be governed by setting the cutoff
points in terms of line counts for (1) the number of "elite" (best-model,
lowest-RMSD) colored lines; (2) the number of the best models for which
to show solute points; and (3) the number of overall visible lines.
It is also possible to choose an alternative color map. The default color
map ranges through the colors of the rainbow from red (best) to magenta
(worst of the elite).
Dialog Sections:
-
Model Documentation: A set of read-only text boxes that
document the type of analysis that was performed.
-
Display Controls: A set of line counters and their
accompanying read-only RMSD equivalents for specifying the
cutoff points of elite, solute-containing, and visible lines.
There are also read-only text boxes showing the best and worst
overall RMSD values from the fits.
-
Color Map: A button for choosing a file containing an
alternative to the default color map.
-
General Control: For example, the Close button.
-
Model Lines Plot: Plotted lines and axes including the
color gradient.
Sample Model Lines Dialogs:
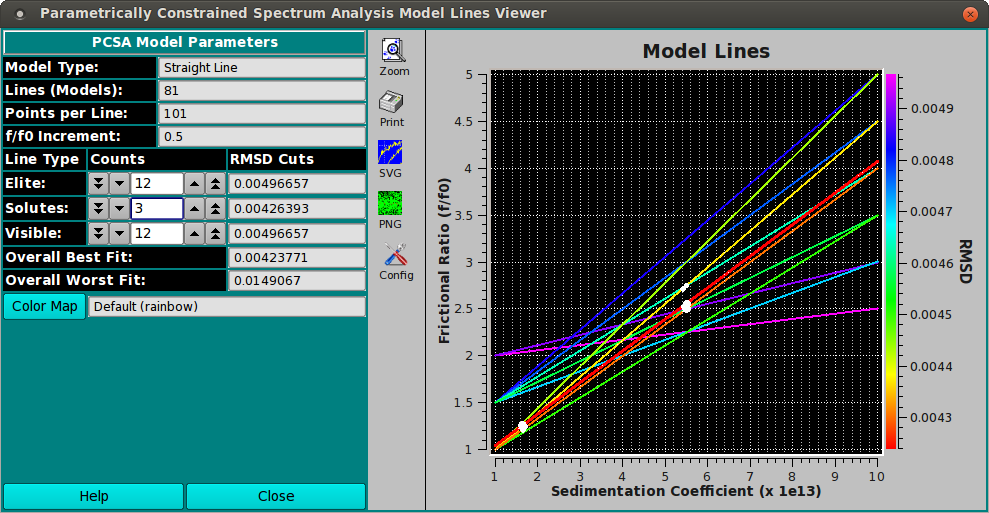
The plot dialog differs slightly based on whether the curve type is
a line or a sigmoid. Below are images for sigmoids and straight line.
Functions:
-
Model Type: Documentation of the type of curve that defines
models.
-
Lines (Models): Documentation of the number of model lines
that were created.
-
Points per Line: Documentation of the number of solute points
in input models.
-
f/f0 Increment: The frictional ratio increment between the
set of start and end point variations for straight-line models.
-
Variation Count: The number of variations in each of par1
and par2 in the computation of sigmoid model curves.
-
Elite: To the right of this label is a counter for setting
the number of colored best-model lines to display.
To the right of the counter is the RMSD-cutoff equivalent.
-
Solutes: To the right of this label is a counter for setting
the number of best-model lines for which solute points are to
be displayed.
To the right of the counter is the RMSD-cutoff equivalent.
-
Visible: To the right of this label is a counter for setting
the number of visible lines to show. Normally, this should range
from the Elite count to the number of total lines.
To the right of the counter is the RMSD-cutoff equivalent.
-
Overall Best Fit: The read-only text box to the right of
this label documents the lowest overall RMSD value encountered.
-
Overall Worst Fit: The read-only text box to the right of
this label documents the highest overall RMSD value encountered.
-
Color Map This button opens a
Load Color Map dialog
in which an alternative color map file may be selected.
To the right of the button is a text box giving the name for the
current selection. A default UltraScan installation will contain
a number of color map files. You can construct your own variation
using the
Color Gradient Generator.
At the opening of the plot dialog, a default rainbow colors map
is selected.
-
Help Display this and other documentation.
-
Close Close all windows and exit.
-
(Model Lines) The plot on the right of the dialog window
displays model lines as controlled by the user. The right side
axis shows the color gradient annotated with corresponding RMSD
values. Note that RMSD values increase from bottom to top, as is
the convention with numeric annotation. But this means that the
color corresponding to the best model is shown on the bottom.
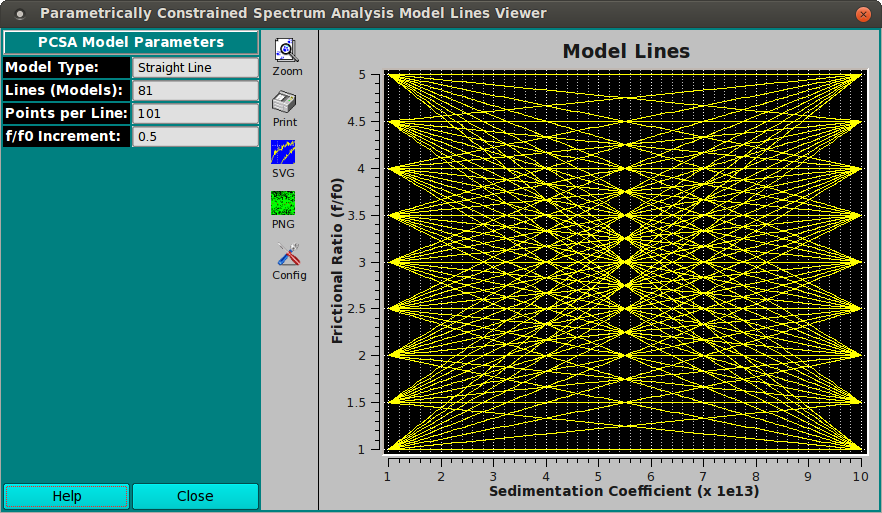
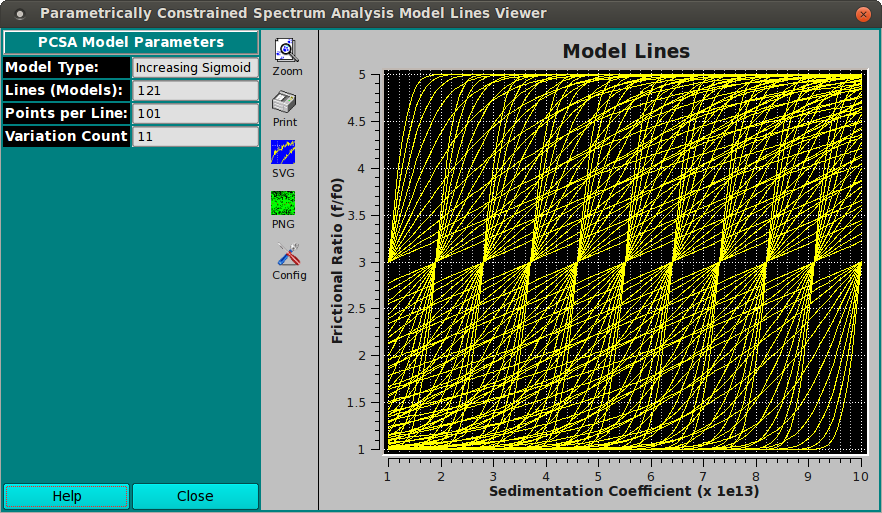
Note that the images and controls documented above are for model
lines plots shown after a fit computation. There are also variations of
this dialog showing pure single-color lines before any fit. There are
4 basic variations of this dialog depending on whether it is displayed
before or after a fit and on whether the curve type is straight line
or sigmoid.
[% INCLUDE footer.us3 %]
 Manual